Introduction
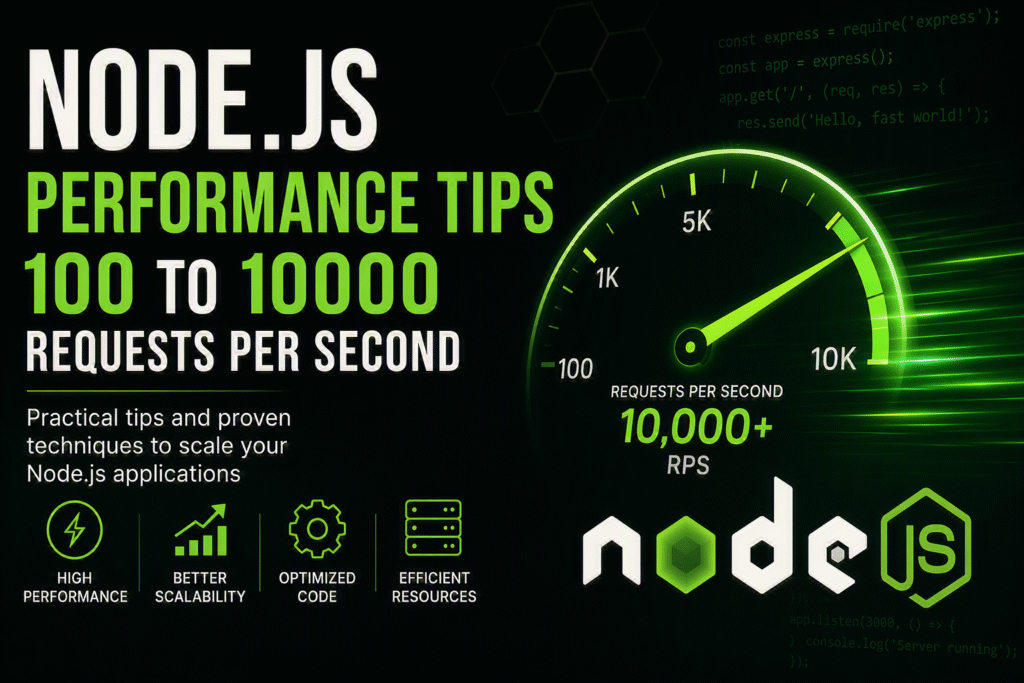
Node.js Performance Optimization :- A basic Node.js API might handle around 100 requests per second (RPS) on modest hardware. However, with proper optimization, you can achieve 10,000 RPS on the same infrastructure. This guide explores practical techniques to bridge this performance gap while maintaining reliability.
Table of Contents
- Node.js Event Loop Fundamentals
- Core Performance Techniques
- Common Performance Pitfalls
- When to Avoid Optimization
- Scaling Strategies
- Production Recommendations
- Debugging Real-World Issues
- Troubleshooting Guide
- Frequently Asked Questions
Event Loop Fundamentals
Understanding the Node.js event loop is crucial for high-performance applications:
| Phase | Description | Performance Consideration |
|---|---|---|
| Timers | Executes setTimeout/setInterval callbacks |
Long-running timers delay I/O operations |
| Pending Callbacks | Processes deferred I/O callbacks | Missing await can cause unexpected delays |
| Poll | Retrieves new I/O events | Synchronous operations here block the loop |
| Check | Runs setImmediate callbacks |
Overuse for CPU work reduces throughput |
| Close | Handles connection cleanup | Resource leaks accumulate over time |
The event loop’s efficiency determines your maximum RPS. Blocking operations in any phase create bottlenecks.
Core Techniques
1. HTTP/2 Implementation
const http2 = require('http2');
const fs = require('fs');

const server = http2.createSecureServer({
  key: fs.readFileSync('cert.key'),
  cert: fs.readFileSync('cert.crt'),
  minVersion: 'TLSv1.3'
});

server.on('stream', (stream, headers) => {
  stream.respond({
    ':status': 200,
    'content-type': 'application/json'
  });
  stream.end(JSON.stringify({ status: 'ok' }));
});

server.listen(8443);
Key Benefit: HTTP/2’s multiplexing reduces connection overhead compared to HTTP/1.1.
2. Lightweight Routing
const http = require('http');
const routes = new Map();

routes.set('GET:/health', (req, res) => {
  res.writeHead(200, { 'Content-Type': 'application/json' });
  res.end(JSON.stringify({ healthy: true }));
});

const server = http.createServer((req, res) => {
  const routeKey = `${req.method}:${req.url.split('?')[0]}`;
  const handler = routes.get(routeKey) || ((req, res) => {
    res.writeHead(404);
    res.end();
  });
  handler(req, res);
});

server.listen(3000);
Performance Gain: Eliminating framework overhead reduces per-request latency.
3. Worker Threads for CPU-Intensive Tasks
const { Worker, isMainThread, parentPort, workerData } = require('worker_threads');

if (isMainThread) {
  module.exports = async (data) => new Promise((resolve, reject) => {
    const worker = new Worker(__filename, { workerData: data });
    worker.on('message', resolve);
    worker.on('error', reject);
  });
} else {
  const crypto = require('crypto');
  const hash = crypto.createHash('sha256')
    .update(workerData)
    .digest('hex');
  parentPort.postMessage(hash);
}
Best Practice: Reserve workers for operations exceeding 200μs execution time.
4. Memory Management
const POOL_SIZE = 65536; // 64KB
const bufferPool = Buffer.allocUnsafe(POOL_SIZE);
let currentOffset = 0;

function serializeToBuffer(obj) {
  const jsonString = JSON.stringify(obj);
  if (jsonString.length > POOL_SIZE - currentOffset) {
    currentOffset = 0; // Reset pool if full
  }
  const bytesWritten = bufferPool.write(jsonString, currentOffset);
  const result = bufferPool.subarray(currentOffset, currentOffset + bytesWritten);
  currentOffset += bytesWritten;
  return result;
}
Advantage: Reduces garbage collection frequency during high load.
5. Thread Pool Configuration
# Set before starting Node.js
export UV_THREADPOOL_SIZE=16
node server.js
Consideration: Increase this value if your application performs concurrent filesystem or crypto operations.
Common Pitfalls
| Issue | Symptoms | Solution |
|---|---|---|
| Synchronous Filesystem Calls | Event loop stalls | Use fs.promises API |
| Large JSON Payloads | High memory usage | Implement streaming parsing |
| Excessive Logging | I/O bottlenecks | Use async logging transports |
| Connection Leaks | Resource exhaustion | Implement proper cleanup handlers |
| Missing Response Termination | Hanging requests | Ensure all paths call res.end() |
Would you like to download as file or copy to clipboard?
When to Avoid
- HTTP/2 in low-latency LAN environments where TLS overhead outweighs benefits
- Worker Threads for operations completing in under 200 microseconds
- Memory Pools in applications with consistently low traffic (<500 RPS)
Scaling Strategies
| Approach | Single Process | Multi-Process |
|---|---|---|
| CPU Utilization | Maximize single-core usage | Cluster with one process per core |
| Memory | Optimize object reuse | Share cache via Redis/Memcached |
| Connections | Tune OS connection limits | Use SO_REUSEPORT for kernel-level balancing |
| State Management | Minimize in-memory state | Externalize session storage |
Pro Tip: Combine cluster module with SO_REUSEPORT for efficient connection distribution.
Production Recommendations
- Process Management:
pm2 start server.js --instances max - Security: Enforce TLS 1.3+ with
minVersion: 'TLSv1.3' - Monitoring: Implement percentile-based latency tracking
- Logging: Use structured JSON format for analysis
- OS Tuning:
sysctl -w net.core.somaxconn=65535
sysctl -w net.ipv4.tcp_tw_reuse=1
ulimit -n 65535
Debugging Examples
GC Pressure Analysis
node --inspect server.js
# Chrome DevTools → Memory → Heap Snapshot
Finding: A library allocated 5MB buffers per request. Switching to pooled buffers reduced GC time by 90%.
DNS Resolution Optimization
const dnsCache = new Map();

async function cachedLookup(hostname) {
  if (dnsCache.has(hostname)) {
    return dnsCache.get(hostname);
  }
  const address = await dns.promises.lookup(hostname);
  dnsCache.set(hostname, address);
  return address;
}
Result: Reduced DNS lookup latency from 30ms to <2ms.
Connection Management
const http = require('http');
http.globalAgent.maxSockets = 1024;
Impact: Resolved socket exhaustion limiting throughput to 1,000 RPS.
Troubleshooting Guide
- CPU Bound: Check
topfor high user-space CPU - Event Loop: Measure latency with
event-loop-lag - Memory: Monitor GC activity via
--trace-gc - Connections: Verify with
lsof -i :<port> - Network: Inspect
netstat -sfor retransmits
FAQ
Q: Is a reverse proxy necessary with SO_REUSEPORT?
A: Only for additional features like TLS termination or advanced routing.
Q: Memory usage at 10k RPS?
A: Approximately 150MB base + 30MB per 1k concurrent connections.
Q: Feasibility on t2.micro?
A: Possible for I/O-bound workloads, but expect 7-8k RPS maximum.
Conclusion
Achieving 10,000 RPS in Node.js requires understanding the event loop, minimizing blocking operations, and proper resource management. By implementing these techniques—lightweight routing, connection pooling, worker threads, and memory optimization—you can significantly improve throughput without hardware changes.